Elliott Wave analysis
Every count of your chart, ranked and argued
Waveanism searches the readings the rules actually permit, tells you what each wave is, and shows you where it would be wrong. No opinions, no hand-drawn lines that only fit in hindsight.
 The product
A count you can measure, question and disagree with
Most wave tools draw one answer and leave you to trust it. This one shows its working: what it found, how the parts subdivide, and the levels that would prove it wrong.
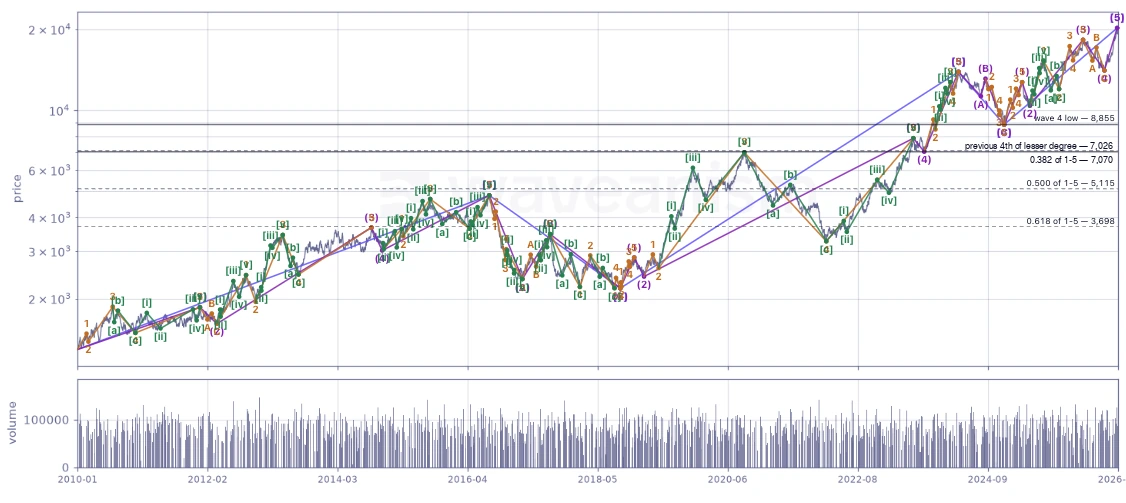
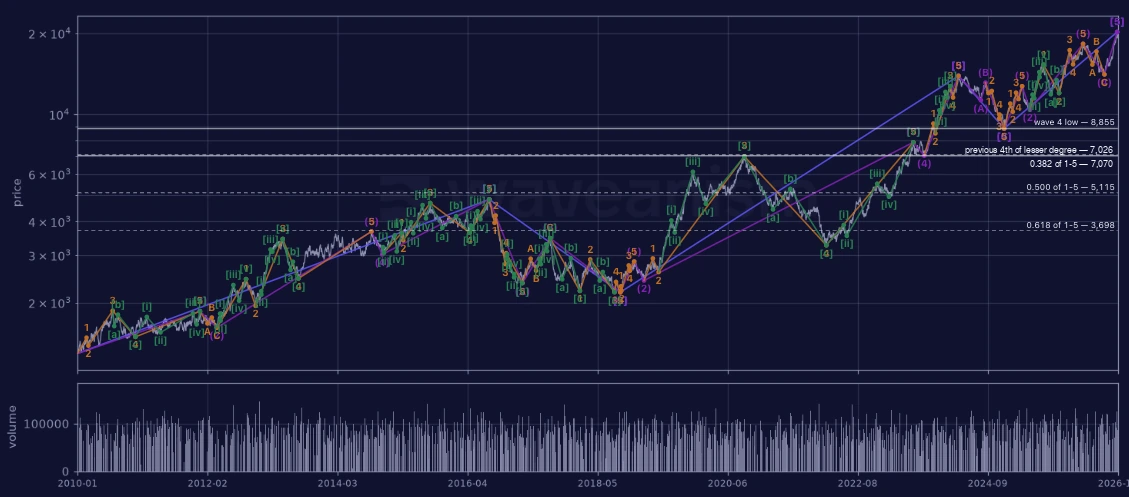
The chart, with the count on it
Every degree drawn over your prices, each one switchable. Turn the subdivisions off to read the shape, on to read the detail.
Measure one wave against another
Pick any two legs and get the ratio in size and in time, checked against the Fibonacci ladder. When nothing fits, it says so rather than naming the nearest number.
What each wave actually is
Wave one a leading diagonal, two a zigzag, four a triangle. The form of every part, one level down — the level where you agree with a reading or throw it out.
Obtain targets from the count
A count that holds implies where the next wave ends. Those levels come out of the same Fibonacci relationships the count was graded on, in price and in time, with the price at which the projection would be void.
The method
The rules are not negotiable
A count that breaks one of these is not a weaker count, it is not a count. The search discards it before you ever see it — which is why the tool sometimes returns nothing, and says so plainly.
RULE 01
Wave two holds
It never retraces the whole of wave one. Past that point the reading is dead.
RULE 02
Three is never shortest
Among waves one, three and five, the third is not the smallest of them.
RULE 03
Four stays clear of one
No overlap into wave one's territory, outside of a diagonal.
GUIDELINES
Alternation is expected
Where two is sharp, four tends sideways. The guidelines are followed too, weighed in how counts are ranked rather than used to rule one out.
These are not Waveanism's rules. They are what Elliott Wave theory has said since 1938 — argued in full, not just asserted.
Under the hood
Built to search, not to guess
Pricing
Subscribe, or own it
Start by bringing your own prices. Licensed market data and the offline desktop build are both in progress — the plans below show where they land.
Silver
$39per month
- 250 counts a month
- Up to 10 alternate counts on every chart
- One timeframe per count
- Arithmetic or logarithmic scale
- Counts to the rules and guidelines
- Five counts a month ranked by the trained model
GoldMost capable
$59per month
- 500 counts a month
- Up to 20 alternate counts on every chart
- Two timeframes nested in one count
- Every count ranked by the trained model
- Set your own tolerance on the rules
- Everything in Silver
Also in progress
Neither is on sale yet. Leave an address and you will hear once, when it is.
Subscription plus dataSoon
$99per month
- Everything in the subscription, no exporting required
- Type a ticker and count it — licensed market data included
- Crypto, forex and equities across global exchanges
- Upload a CSV as well, whenever you want to
Desktop licenceSoon
$10,000once, yours to keep
- Everything the subscription does, on your machine, plus counting across timeframes
- Runs offline on Windows 11 (Apple silicon coming soon)
- Your data and your API keys never leave the machine
- A year of upgrades included; renew later only if you want them
A lapsed upgrade year never stops the software: you keep running every version your licence covered, for as long as you like. Prices for the two plans in progress are indicative and may change before release.
Questions
Reasonable questions
Does this tell me what to buy?
No, and it is not built to. It reports which readings the rules permit, how well each fits the Fibonacci relationships, and the price at which each one would be invalidated. What you do with that is your decision.
What happens to a CSV I upload?
It is read once to build the price series, then dropped. Nothing is written to disk and no copy is kept once the count finishes. The desktop version never sends the file anywhere at all.
Why does it sometimes return nothing?
Because no legal reading of that chart matches what you asked for. That is an answer, not a failure. Narrow the search hard enough and the rules will correctly refuse every candidate — which tells you something a tool that always draws five waves cannot.
Why only one timeframe on the subscription?
Counting one chart is seconds of work. Counting a stack of timeframes and reconciling the degrees between them is a great deal more, and it runs on our hardware. The desktop licence runs on yours, so it does the whole stack.
Can I use my own data provider?
On the desktop version, yes — point it at whichever feed you already pay for and the key stays on your machine. In the browser, use our licensed data or bring a CSV exported from anywhere.
Count a chart you already have an opinion about
That is the honest test. Run one where you think you know the answer, and see whether the rules agree with you.